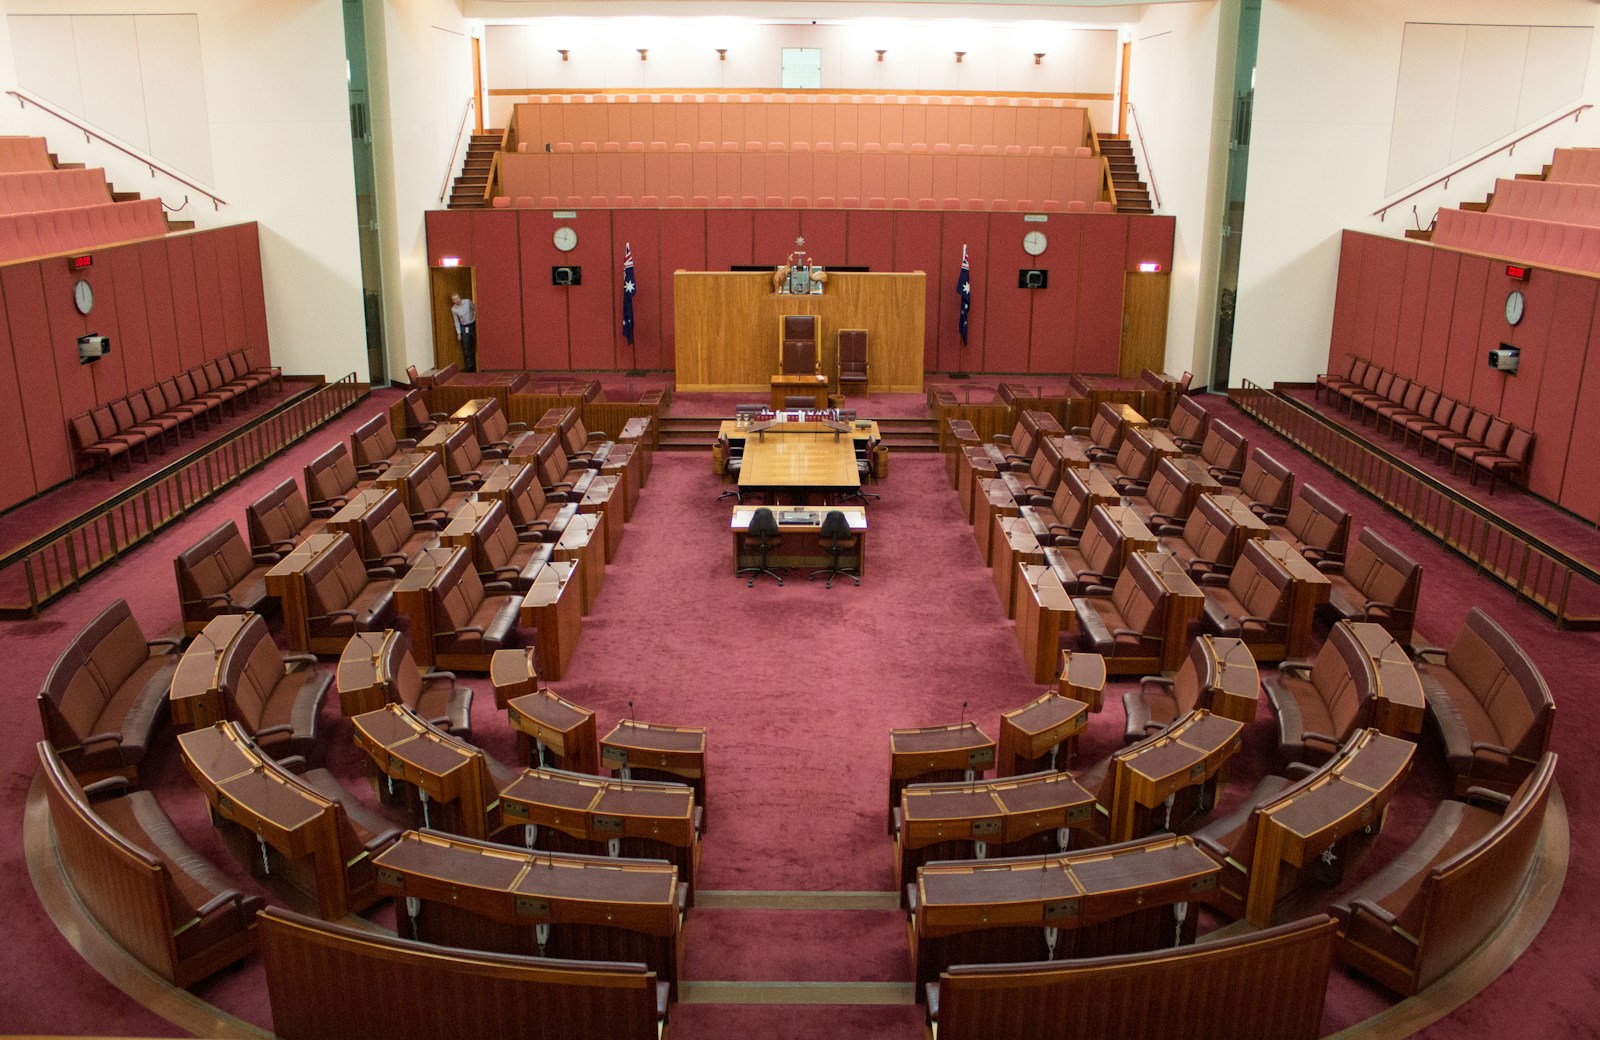
Environment and Communications Legislation Committee
28/10/2022
Estimates
CLIMATE CHANGE, ENERGY, THE ENVIRONMENT AND WATER PORTFOLIO
Department of Climate Change, Energy, the Environment and Water
—
It’s bad enough that the science is flawed but the manipulation of the temperature records is even worse.
$40 million dollar computer to aid and abet it as well. Gotta keep the people confused.
Estimates is on this week. I will try my hardest to hold our bureaucrats and the government to account. But they are very good at wriggling their way out of giving straight answers.
—
Senator RENNICK: My first question is for the assistant minister, Senator McAllister. I’m not sure whether you’re familiar, but the bureau has three datasets, basically. Raw data are at ACORN 1 and ACORN 2, which are homogenised datasets. In terms of trying to measure the temperature going forward—because, as you know, the Albanese government has signed up to reducing carbon emissions by 43 per cent in order to limit the world’s temperature by 1½ degrees—which dataset will the government be using to benchmark that?
Dr Johnson : I might ask Dr Stone to answer that. I know you and Dr Stone have been longstanding correspondents on this matter.
Senator RENNICK: Yes, we’ve had many conversations over the years.
Dr Stone : Thanks for the question. The bureau will continue to acquire about a billion observations every day and make those available as data in four main categories, and there are four categories because different data are used for different purposes. The first of the four categories of data that we have is raw data, which is data initially received by the bureau from instruments and observers. That’s the data that is mainly used for current weather observations, such as those that appear on the Bureau of Meteorology website or the app. The second category of data is quality control data. That’s raw data for key variables that undergoes a higher level of quality assurance. That’s the most common form of data used by bureau customers—for example, observed historical rainfall or temperature data for a particular location. It’s important to note, too, that that’s actually the data that is used for most standard reporting, including, for example, the hottest or coldest days on record and how far temperatures have been above or below average for a given period. So, that’s quality control data.
The third category of data is homogenised data. We’ll continue to acquire observations and, as a third category, homogenise it. Of course, that’s where the data are used to assess long-term temperature change and variability. That’s the ACORN-SAT data that you’re referring to. And the fourth category of data that we make available is gridded datasets. That’s really a statistical treatment of the data so that, rather than being point estimates for given places—for example, where there is an automatic weather station—it gets treated basically so that it can appear on a map, and that’s as gridded datasets. We’ll continue to take our roughly billion observations every day and make those available as data in those four categories.
Senator RENNICK: But which one are we going to use as the benchmark to work out whether the temperature is increasing or decreasing?
Dr Stone : It’s the homogenised data that is created in order to create that long-term temperature trend.
Senator RENNICK: That homogenised data is not the same as the raw data. You basically change that. It’s not the same as the raw data, so there’s an amount of human interaction with that.
Dr Stone : Absolutely.
Senator RENNICK: I guess my problem is, if you’re changing the data from the raw data, how do we know it’s the right data? And I remember that Marble Bar conversation about where you make 400 million iterations to the maximum temperature and 250 million iterations to the minimum temperature. It’s pretty hard for that to get audited, to know that the data’s got integrity, I guess. That’s my problem: how can we genuinely benchmark the temperature? As you say, there are a billion recordings every day.
Dr Stone : Understood. That’s why there are the four categories of data available. I mean, homogenisation is a statistical treatment of data, to take out known anomalies in that data. We’ll continue to do that, because it’s fit for that purpose. I do just want to be clear: the raw data, the quality assured data—and, if you want to grid it and look at it—all show an increasing temperature trend.
Senator RENNICK: Yes, I’m not disputing that. With these brilliant recordings you get each day, you have a supercomputer for that, don’t you?
Dr Stone : They’re assimilated, and many of those observations are used in our numerical weather prediction models, which are used to create the forecasts.
Senator RENNICK: And that cost $40 million, didn’t it? Is that true? Did I read that?
Dr Stone : In what context?
Senator RENNICK: How much did that supercomputer cost?
Dr Stone : The supercomputer?
Senator RENNICK: Yes. How much did it cost?
Dr Johnson : I can give you an exact number. We have a supercomputer that’s running as we speak. If you wish to wait a minute, I can get you the actual number. It’s of that order.
Senator RENNICK: Right.
Dr Johnson : Or, if you’d like an exact number, I can take it on notice. It’s around that—
S enator RENNICK: I just find it interesting because everyone’s jumping up and down about your name change for 200 grand, and there’s a supercomputer that you bought for $40 million that homogenises data that I don’t think people are aware of at all.
Dr J ohnson : Yes. I’ll get back to you on that, but it’s of that order.
Senator RENNICK: Thanks, guys. See you next time.


